EDBB Traffic Overview
In the
EDBB Control Panel, open your VPS and switch to the Traffic
tab. It shows the current cycle, auto-hydration settings, pool balance, and usage charts at a glance.
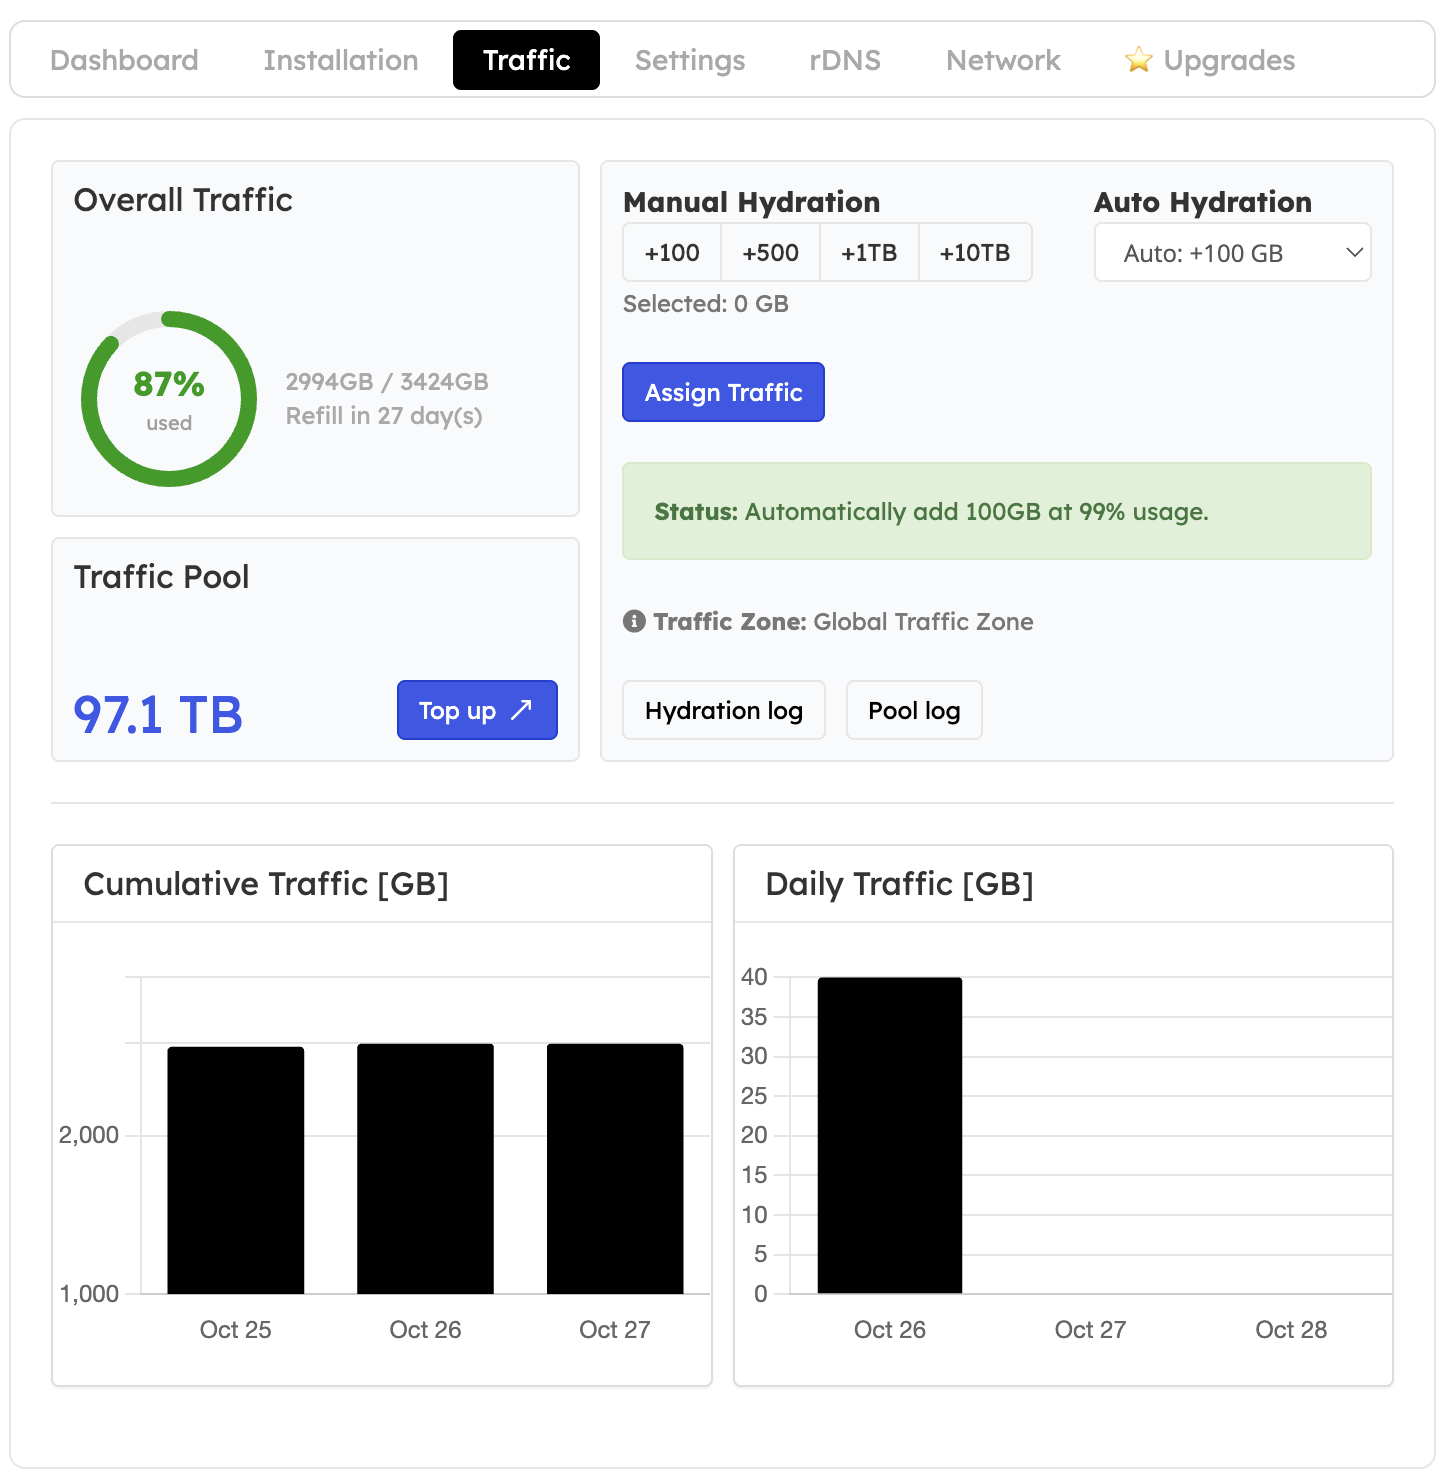
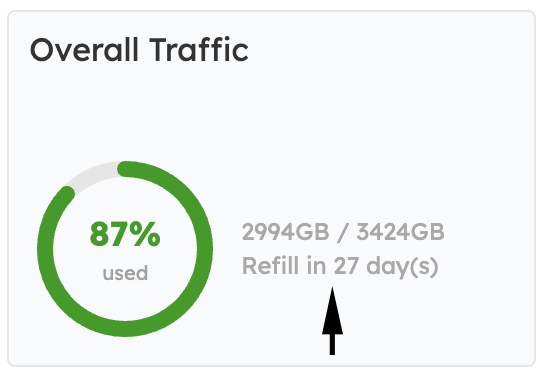
Read the Summary Card
- Progress ring – % of your monthly allowance consumed.
- Numerical usage – exact GB used vs. available.
- Refill timer – when the allowance resets (matches your VPS renewal date).
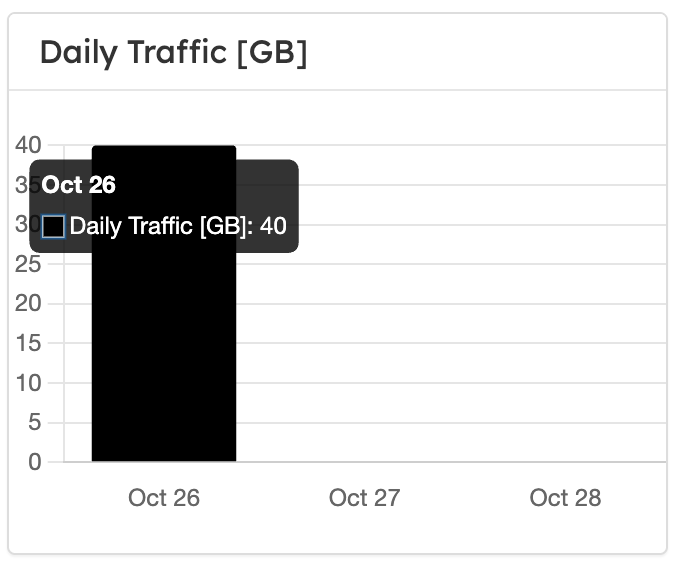
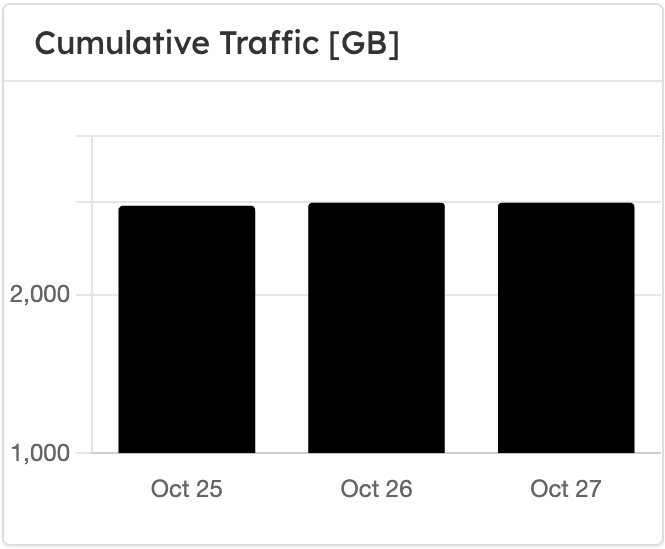
Inspect Daily - Cumulative Graphs
- Hover over the bars to see each day’s combined ingress + egress in GB.
- Use the cumulative chart to verify long-running jobs or unexpected spikes.
Manage Traffic Pool - Hydration
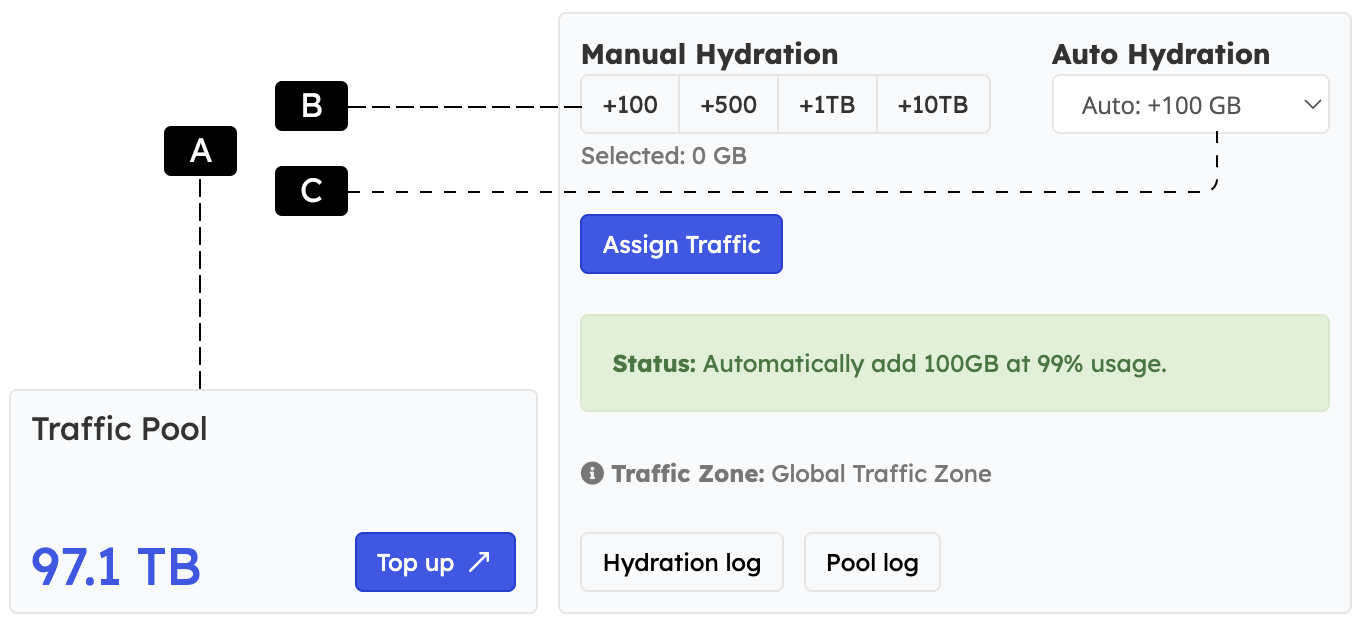
Shows the shared balance for your account. Click “Top up” to purchase more capacity when needed. B — Manual Hydration
Select a block (+100 GB, +500 GB, +1 TB, +10 TB) and press Assign Traffic to add it instantly to the VPS. C — Auto Hydration
Set a top-up size (e.g., +100 GB). When usage hits 99%, the chosen amount is assigned automatically. Check the status banner for the active rule. All assignments are logged under Hydration log and Pool log.
What Happens at 100% Usage
Grace & throttle
After a 5% grace buffer, the NIC is capped at roughly 64 kbit/s
. The VPS stays online but feels slow.
Restore full speed
Assign pool traffic, upgrade the plan, or wait for the monthly refill—any of these actions lifts the throttle immediately.