> ## Documentation Index
> Fetch the complete documentation index at: https://docs.edbb.com/llms.txt
> Use this file to discover all available pages before exploring further.
# Traffic Stats & Monthly Refills
> Review how EDBB meters VPS traffic, when traffic refills happen, and what happens when all traffic has been consumed.
## EDBB Traffic Overview
In the
EDBB Control Panel
, open your VPS and switch to the Traffic
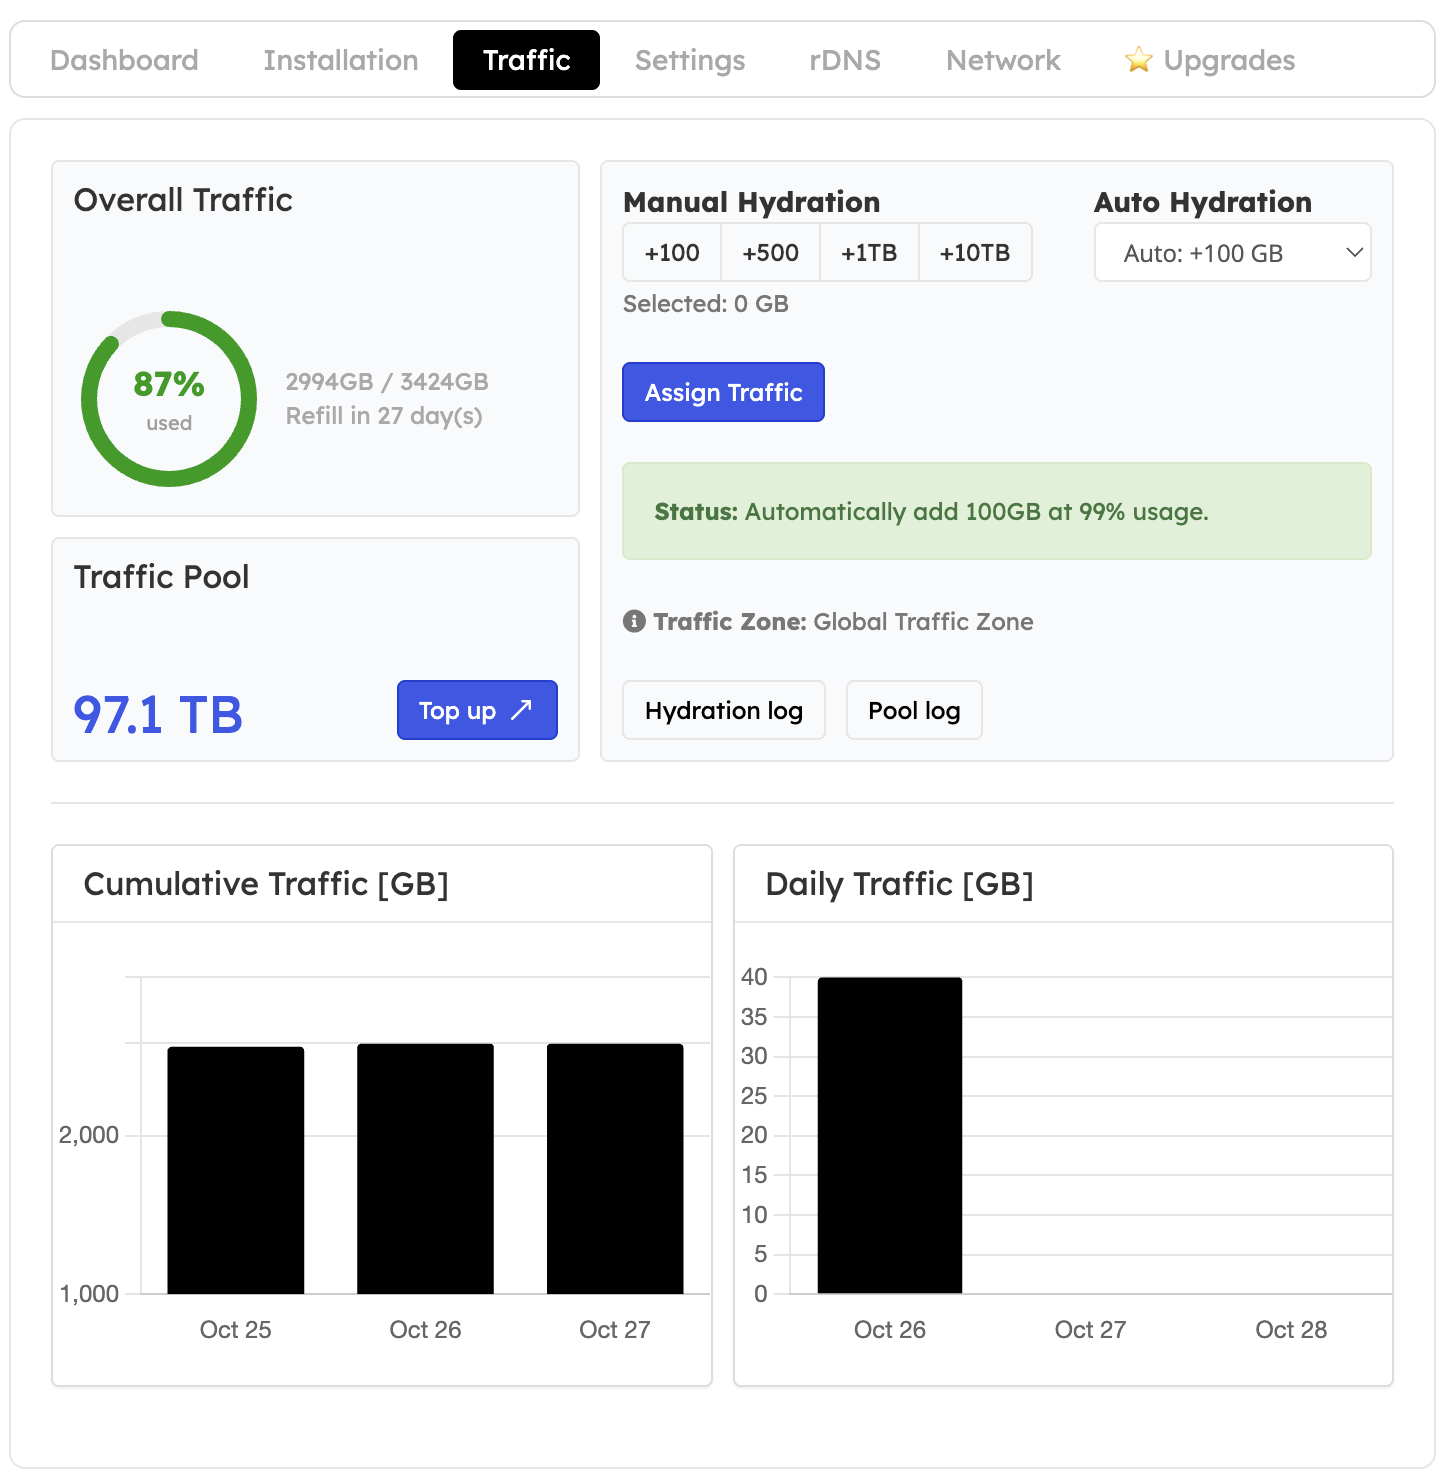
tab. It shows the current cycle, auto-hydration settings, pool balance, and usage charts at a glance.
 ***
## Read the Summary Card
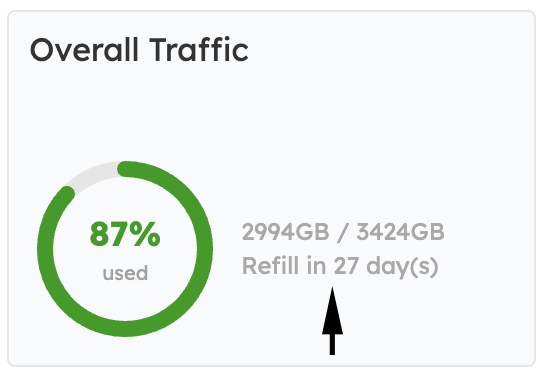
* **Progress ring** – % of your monthly allowance consumed.
* **Numerical usage** – exact GB used vs. available.
* **Refill timer** – when the allowance resets (matches your VPS renewal date).
***
## Read the Summary Card
* **Progress ring** – % of your monthly allowance consumed.
* **Numerical usage** – exact GB used vs. available.
* **Refill timer** – when the allowance resets (matches your VPS renewal date).
 Email alerts land at 80%, 90%, and 100%, but the Control Panel indicator is the quickest way to spot high usage.
***
## Inspect Daily - Cumulative Graphs
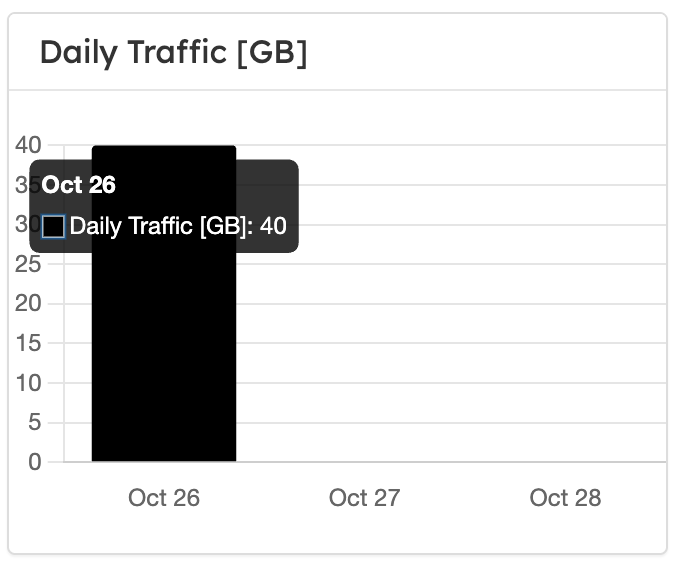
* Hover over the bars to see each day’s combined ingress + egress in GB.
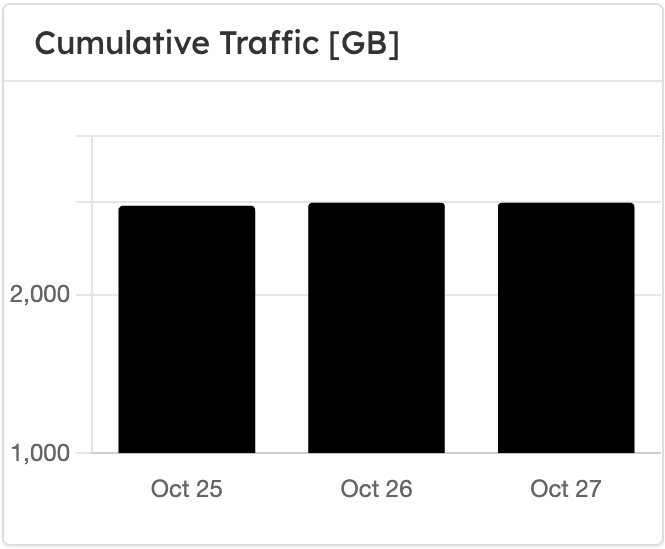
* Use the cumulative chart to verify long-running jobs or unexpected spikes.
Totals reset automatically at the start of the next billing cycle.
***
## Manage Traffic Pool - Hydration
Email alerts land at 80%, 90%, and 100%, but the Control Panel indicator is the quickest way to spot high usage.
***
## Inspect Daily - Cumulative Graphs
* Hover over the bars to see each day’s combined ingress + egress in GB.
* Use the cumulative chart to verify long-running jobs or unexpected spikes.
Totals reset automatically at the start of the next billing cycle.
***
## Manage Traffic Pool - Hydration
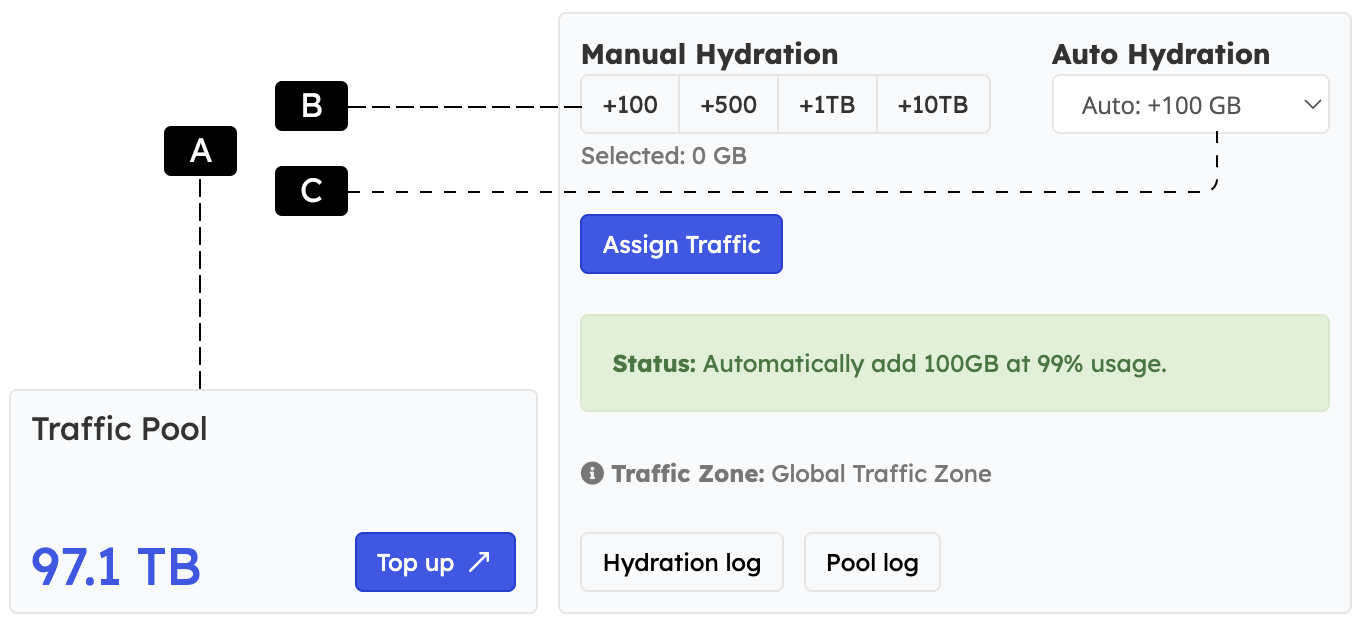 **A — Traffic Pool**\
Shows the shared balance for your account. Click “Top up” to purchase more capacity when needed.
**B — Manual Hydration**\
Select a block (+100 GB, +500 GB, +1 TB, +10 TB) and press **Assign Traffic** to add it instantly to the VPS.
**C — Auto Hydration**\
Set a top-up size (e.g., +100 GB). When usage hits 99%, the chosen amount is assigned automatically. Check the status banner for the active rule.
All assignments are logged under **Hydration log** and **Pool log**.
***
## What Happens at 100% Usage
After a 5% grace buffer, the NIC is capped at roughly 64 kbit/s
. The VPS stays online but feels slow.
Assign pool traffic, upgrade the plan, or wait for the monthly refill—any of these actions lifts the throttle immediately.
Monitor the Traffic tab and enable auto hydration if you run resource-heavy workloads. Always keep recent off-site backups in case you choose to wait for the reset window.
### How We Meter Traffic
EDBB reads traffic counters directly on the Ethernet interfaces of your Virtual Private Servers in real-time. The total traffic usage is determined by summing up the ingress (incoming) and egress (outgoing) traffic.
$Total Traffic = \sum (\text{IN} + \text{OUT})$
**A — Traffic Pool**\
Shows the shared balance for your account. Click “Top up” to purchase more capacity when needed.
**B — Manual Hydration**\
Select a block (+100 GB, +500 GB, +1 TB, +10 TB) and press **Assign Traffic** to add it instantly to the VPS.
**C — Auto Hydration**\
Set a top-up size (e.g., +100 GB). When usage hits 99%, the chosen amount is assigned automatically. Check the status banner for the active rule.
All assignments are logged under **Hydration log** and **Pool log**.
***
## What Happens at 100% Usage
After a 5% grace buffer, the NIC is capped at roughly 64 kbit/s
. The VPS stays online but feels slow.
Assign pool traffic, upgrade the plan, or wait for the monthly refill—any of these actions lifts the throttle immediately.
Monitor the Traffic tab and enable auto hydration if you run resource-heavy workloads. Always keep recent off-site backups in case you choose to wait for the reset window.
### How We Meter Traffic
EDBB reads traffic counters directly on the Ethernet interfaces of your Virtual Private Servers in real-time. The total traffic usage is determined by summing up the ingress (incoming) and egress (outgoing) traffic.
$Total Traffic = \sum (\text{IN} + \text{OUT})$