> ## Documentation Index
> Fetch the complete documentation index at: https://docs.edbb.com/llms.txt
> Use this file to discover all available pages before exploring further.
# Investigate unusual network usage
> Find which connections and processes are using your Linux VPS traffic. Compare live traffic with EDBB statistics, investigate the cause and stop unwanted activity.
Unexpected traffic can come from legitimate downloads, backups, application demand, a configuration error or a compromised system. Identify the cause before deleting files or stopping services.
## Check when the traffic increased
Compare the EDBB **Traffic** tab with application logs and scheduled jobs. Traffic includes incoming and outgoing data. Record when the increase began and whether the destination, protocol or service is expected.
## Measure live traffic
On Debian or Ubuntu, install the monitoring tools from your distribution's repositories:
```bash theme={"system"}
sudo apt update
sudo apt install iftop nethogs vnstat
ip -br link
```
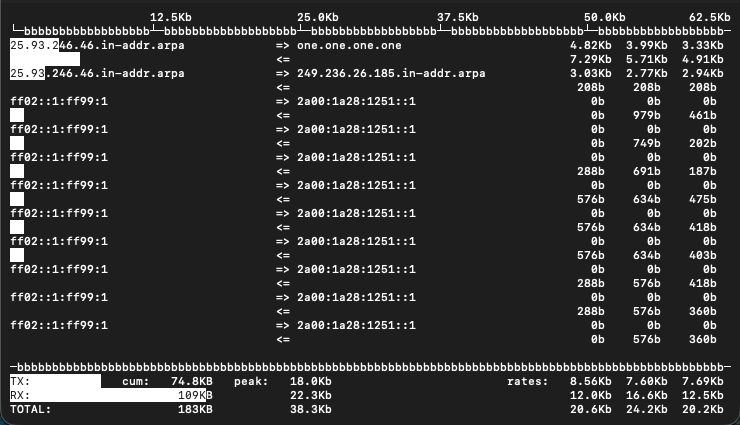
Replace `eth0` below with your VPS's network interface. Run `iftop` to see the connections using the most bandwidth:
```bash theme={"system"}
sudo iftop -n -P -i eth0
```
Watch the send/receive rates and remote addresses while the problem is happening. Press `q` to exit. These are live measurements, not a reconstruction of traffic from before the tool was running.
 ## Find the process using the traffic
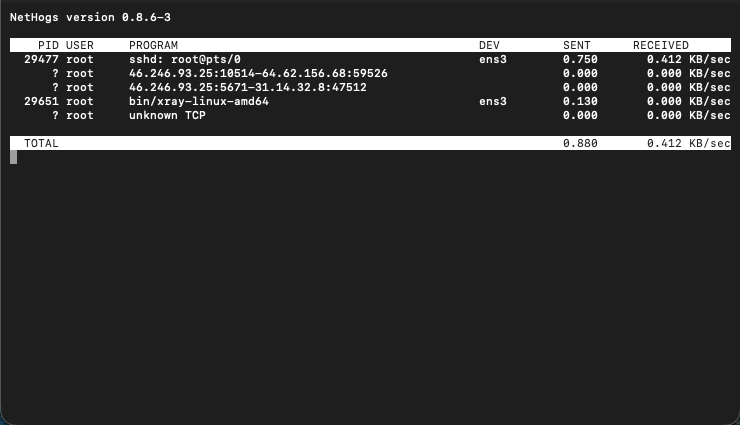
Run `nethogs` to group current traffic by process:
```bash theme={"system"}
sudo nethogs eth0
```
Look for a process with sustained high send or receive rates. Press `q` to exit.
## Find the process using the traffic
Run `nethogs` to group current traffic by process:
```bash theme={"system"}
sudo nethogs eth0
```
Look for a process with sustained high send or receive rates. Press `q` to exit.
 Then inspect its connections and service. These commands list connections and processes without stopping them:
```bash theme={"system"}
sudo ss -tupn
ps aux
systemctl --type=service --state=running
```
Package names, proxy software and remote connections are not themselves evidence of malware. Match a process to its executable, service configuration, owner and expected workload. Keep logs private and redact secrets before sharing.
## Preserve evidence before stopping a process
Record the process ID, command line, executable path, connections and relevant logs while the process exists. For example, replace `1234` with the PID you found:
```bash theme={"system"}
ps -fp 1234
sudo readlink -f /proc/1234/exe
sudo cat /proc/1234/cmdline | tr '\0' ' '
```
Command lines can contain secrets. Keep the output private and remove credentials before sharing it. Linux `/proc/PID/` entries disappear when a process exits. Store evidence with restricted access on a separate system if an incident investigation requires it.
Do not run blanket removal commands for directories or executable names. Do not execute a suspicious file to identify it.
## Stop unwanted activity
Use the [VNC console](/vps-management/enable-vnc-server) as a recovery path before changing the firewall. Restrict the affected service or stop it after identifying it and preserving necessary evidence. Ordinary UFW rules filter traffic by network properties; they do not identify a malicious process by its name.
For suspected compromise, rotate exposed credentials from a trusted device, investigate persistence and affected accounts, and consider rebuilding from a trusted image after preserving needed evidence and data. A deleted executable does not prove that the system is clean.
If you received an abuse notice, follow [responding to abuse](/misc/responding-to-abuse-complaints) and reply with your findings and remediation. See [SSH hardening](/getting-started/ssh-security-hardening) and [backups](/backups).
## Keep a usage history
`vnstat` records interface totals after it is installed and running. Enable its service and check the interface:
```bash theme={"system"}
sudo systemctl enable --now vnstat
vnstat --iflist
vnstat -i eth0
```
If your installed version has not added the interface automatically, add it with `sudo vnstat --add -i eth0`, then restart the `vnstat` service. Allow time for it to collect data. Use `vnstat -d -i eth0` for daily totals.
Local tools may use different units or time periods from the panel. EDBB traffic includes **incoming plus outgoing** data; use the [Traffic tab](/faq/traffic-bandwidth/traffic-statistics) to check the allowance and refill date. EDBB reads interface counters and does not identify which application generated the traffic for you.
Then inspect its connections and service. These commands list connections and processes without stopping them:
```bash theme={"system"}
sudo ss -tupn
ps aux
systemctl --type=service --state=running
```
Package names, proxy software and remote connections are not themselves evidence of malware. Match a process to its executable, service configuration, owner and expected workload. Keep logs private and redact secrets before sharing.
## Preserve evidence before stopping a process
Record the process ID, command line, executable path, connections and relevant logs while the process exists. For example, replace `1234` with the PID you found:
```bash theme={"system"}
ps -fp 1234
sudo readlink -f /proc/1234/exe
sudo cat /proc/1234/cmdline | tr '\0' ' '
```
Command lines can contain secrets. Keep the output private and remove credentials before sharing it. Linux `/proc/PID/` entries disappear when a process exits. Store evidence with restricted access on a separate system if an incident investigation requires it.
Do not run blanket removal commands for directories or executable names. Do not execute a suspicious file to identify it.
## Stop unwanted activity
Use the [VNC console](/vps-management/enable-vnc-server) as a recovery path before changing the firewall. Restrict the affected service or stop it after identifying it and preserving necessary evidence. Ordinary UFW rules filter traffic by network properties; they do not identify a malicious process by its name.
For suspected compromise, rotate exposed credentials from a trusted device, investigate persistence and affected accounts, and consider rebuilding from a trusted image after preserving needed evidence and data. A deleted executable does not prove that the system is clean.
If you received an abuse notice, follow [responding to abuse](/misc/responding-to-abuse-complaints) and reply with your findings and remediation. See [SSH hardening](/getting-started/ssh-security-hardening) and [backups](/backups).
## Keep a usage history
`vnstat` records interface totals after it is installed and running. Enable its service and check the interface:
```bash theme={"system"}
sudo systemctl enable --now vnstat
vnstat --iflist
vnstat -i eth0
```
If your installed version has not added the interface automatically, add it with `sudo vnstat --add -i eth0`, then restart the `vnstat` service. Allow time for it to collect data. Use `vnstat -d -i eth0` for daily totals.
Local tools may use different units or time periods from the panel. EDBB traffic includes **incoming plus outgoing** data; use the [Traffic tab](/faq/traffic-bandwidth/traffic-statistics) to check the allowance and refill date. EDBB reads interface counters and does not identify which application generated the traffic for you.